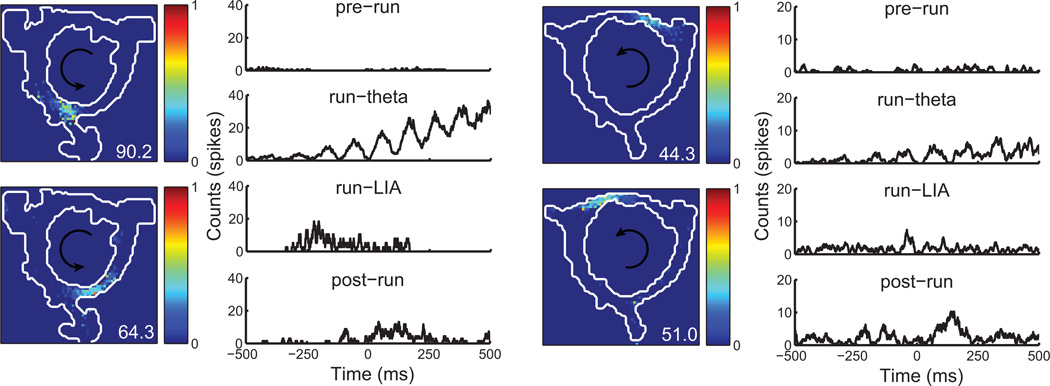
Figure 1.
Examples of spatial firing rate maps and cross-correlograms for two cell pairs. Firing rate maps are normalized for ease of visual comparison (peak rate of the cell is indicated in the bottom-right corner of each rate map). During the pre-run epoch, little coordinated spiking is present. In contrast, during the run-theta epoch a strong, theta-modulated correlation is apparent. During the run-LIA and post-run epochs, peaks in the correlograms consistent with forward and backward-ordered sequential activity are present.

