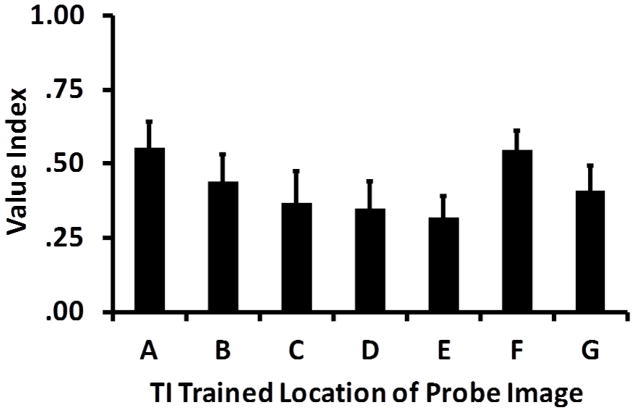
Figure 5.
Average measured value index for each TI stimulus when presented as a probe in Experiment 2. Value indexes reflect the proportion of touches to the TI probe image during the 30s presentation in the concurrent RI format. Associative value accounts predict a linear decrease in values from the highest ranked item, A, to the lowest ranked item, G. Error bars are standard errors.

