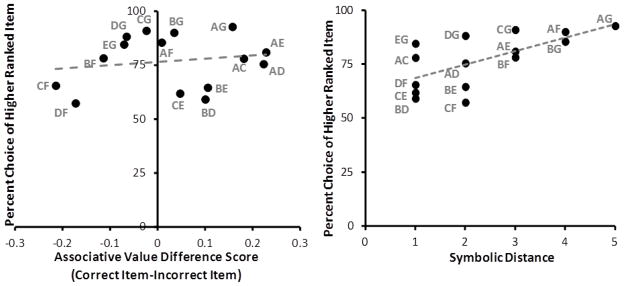
Figure 6.

Average percent choice of higher ranked item for all non-adjacent TI test pairs in the transitive inference stimulus sets as a function of associative value difference score (left) and symbolic distance (right). Each point represents one transitive inference test pair. Trend lines are indicated with a dashed line. GLMM analysis of associative value difference scores accounted for individual variability not shown in this averaged graph. There was no significant relationship between accuracy and value difference score.
