
Fig. 2.
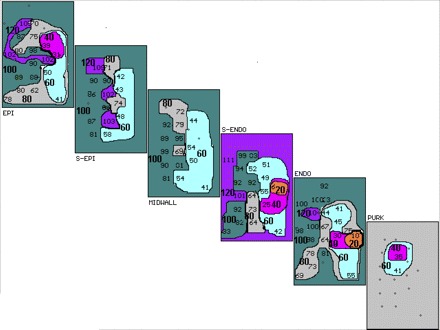
Three-dimensional activation map of the last premature stimulated complex (S4) in Fig. 1. Activation maps of the epicardial (EPI), subepicardial (S-EPI), midwall, subendocardial (S-ENDO), endocardial (ENDO), and Purkinje (PURK) planes are shown. Activation times are in milliseconds (ms) for each electrode site. Maps are drawn in 20-ms isochrones (different colors, marked by bold numbers with earliest shown in orange) after the stimulus. Earliest intracardiac activity is seen in S-ENDO layer at 6 ms. Activation proceeds to the PURK layer and out to the EPI layers, with no conduction block and no significant conduction delay in the PURK or ENDO layers adjacent to where the first activation of VT occurs (Fig. 3).