
Fig. 3.
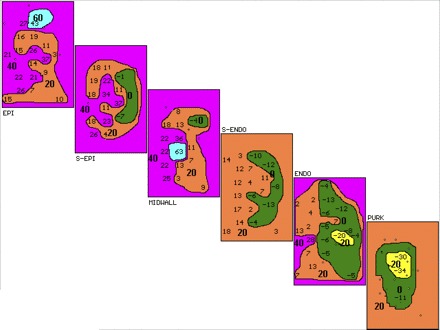
Three-dimensional activation map of third VT complex in Fig. 1. Activation maps of the planes through the ventricular wall labeled as in Fig. 2 are shown. Isochrones (20 ms shown in bold) start with the earliest activity shown in yellow before (−) or after the onset of the surface QRS. Transmural activation starts in PURK and proceeds to EPI. Earliest activation is seen in the PURK, 34 ms before the onset of surface QRS, with activation proceeding to surrounding PURK and transmurally to midwall, where the latest activity is seen 63 ms after QRS. There is not enough conduction delay or retrograde conduction from EPI to PURK to suggest reentry.