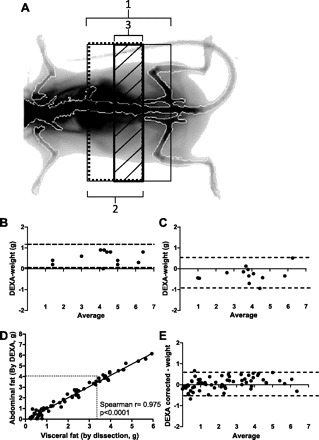
Fig. 1.

Relationship between visceral fat measured by dual-energy X-ray absorptiometry (DEXA) and visceral fat measured by dissection. A: graph of regions of interest (ROI) used to calculated visceral fat by DEXA scan. ROI 1 extends from S3/S4 vertebral space to L5/L6 vertebral space (thin solid line). ROI 2 extends from S3/S4 vertebral space to L3/L4 vertebral space (dotted line). ROI3 extends from L1/L2 to L4/L5 vertebral space (bold line, diagonally striped bar). B: Bland-Altman plot of the difference between DEXA scan (ROI 3) and dissection of visceral fat against the average of the 2 methods (DEXA + dissection/2). DEXA scan was performed before the removal of SAT (n = 13). C: Bland-Altman plot of the difference between DEXA scan (ROI 3) and dissection of visceral fat against the average of the 2 methods (DEXA + dissection/2). DEXA scan was performed after the removal of SAT (n = 13). D: linear regression between abdominal fat measured by DEXA (corrected by subtraction of bias factor, 0.65) and visceral fat measured by dissection. The solid line represents the regression from which the correlation coefficient was calculated, Spearman r = 0.975, P < 0.0001; n = 69. E: Bland-Altman plot of the difference between DEXA scan (ROI 3) and dissection of visceral fat against the average of the 2 methods (DEXA + dissection/2). DEXA scan was corrected by subtraction of bias factor (n = 69).
