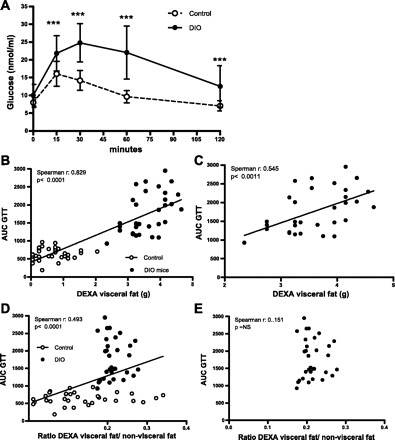
Fig. 5.

DEXA visceral fat correlates with area under the curve of glucose tolerance test (AUC GTT) in DIO mice. A: GTT of C57BL/6J mice on regular diet (○; n = 28) and DIO mice (●; n = 28). B: correlation between visceral fat measured by DEXA scan and AUC GTT in C57BL/6J mice on regular diet (○; n = 28) and DIO mice (●; n = 28). C: correlation between visceral fat measured by DEXA scan and AUC GTT in DIO mice (●; n = 28). D: correlation between the ratio of DEXA visceral fat to nonvisceral fat and AUC GTT in C57BL/6J mice on regular diet (○; n = 28) and DIO mice (●; n = 28). E: correlation between the ratio of DEXA visceral fat to nonvisceral fat and AUC GTT in DIO mice (●; n = 28). Results are means ± SD. ***P < 0.001.
