
FIGURE 2.
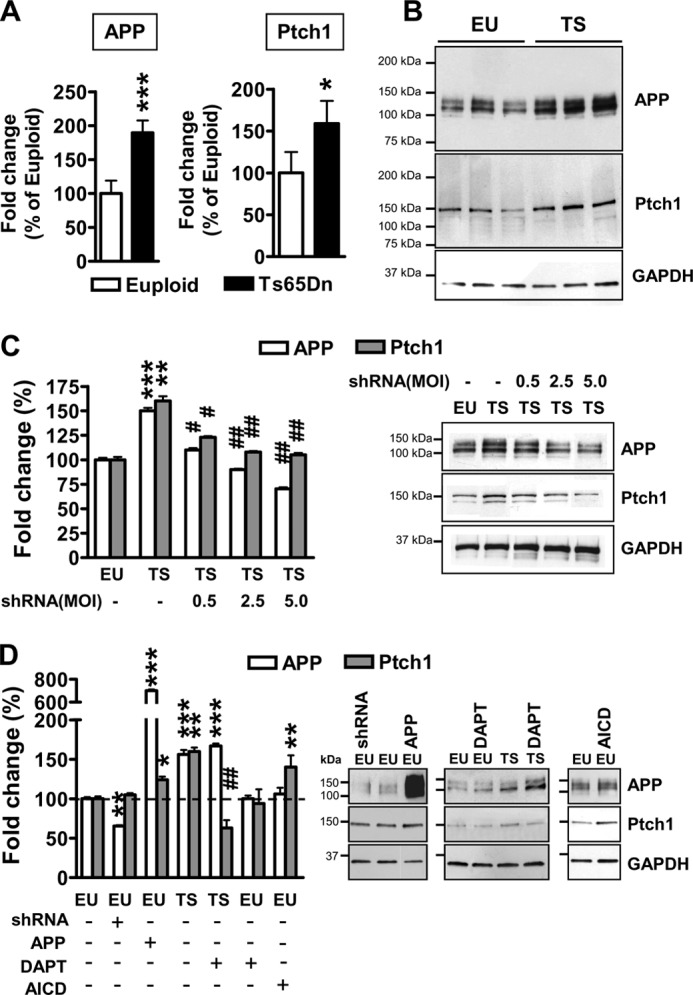
Ptch1 overexpression is mediated by the APP/AICD system in differentiated NPCs from Ts65Dn mice. A, shown is relative quantification by RT-qPCR of APP and Ptch1 expression in 6-day-differentiated NPCs derived from Ts65Dn (TS, n = 6) and euploid (EU, n = 6) mice, given as a percentage of the euploid condition. Values represent the mean ± S.E. *, p < 0.05; ***, p < 0.001 (two-tailed t test). B, shown is an example of Western blot analysis of APP and Ptch1 expression in 6-day-differentiated NPCs from euploid and Ts65Dn mice. C, shown is the effect of APP silencing on APP and Ptch1 expression in differentiating NPCs from Ts65Dn mice. NPCs from Ts65Dn mice (n = 5) were infected with APP shRNA lentiviral particles at increasing m.o.i. (0.5, 2.5, and 5.0). NPCs from euploid mice (n = 6) were used as a control. APP and Ptch1 protein levels were normalized by GAPDH content and are expressed as percentages of the euploid untreated condition (100%). Values are the means ± S.E. **, p < 0.01; ***, p < 0.001 as compared with the euploid condition; #, p <0.05; ##, p < 0.01 as compared with untreated trisomic samples (Bonferroni test after ANOVA). D, shown is the effect of APP or AICD overexpression and APP or AICD down-regulation on APP and Ptch1 expression in differentiating NPCs from euploid and Ts65Dn mice. NPCs from euploid mice (n = 5) were infected with APP shRNA lentiviral particles (m.o.i. 5) or APP adenovirus particles (m.o.i. 25) or AICD lentiviral particles. To inhibit AICD formation, NPCs from euploid (n = 4) and Ts65Dn (n = 6) mice were treated with the γ-secretase inhibitor N-[N-(3,5-difluorophenacetyl)-l-alanyl]-S-phenylglycine t-butyl ester (DAPT; 10 μm). APP and Ptch1 protein levels were normalized by GAPDH content and are expressed as percentages of the euploid-untreated condition (100%). Values are the means ± S.E. *, p < 0.05; **, p < 0.01; ***, p < 0.001 as compared with the euploid condition; ##, p < 0.01 as compared with untreated trisomic samples (Bonferroni test after ANOVA).