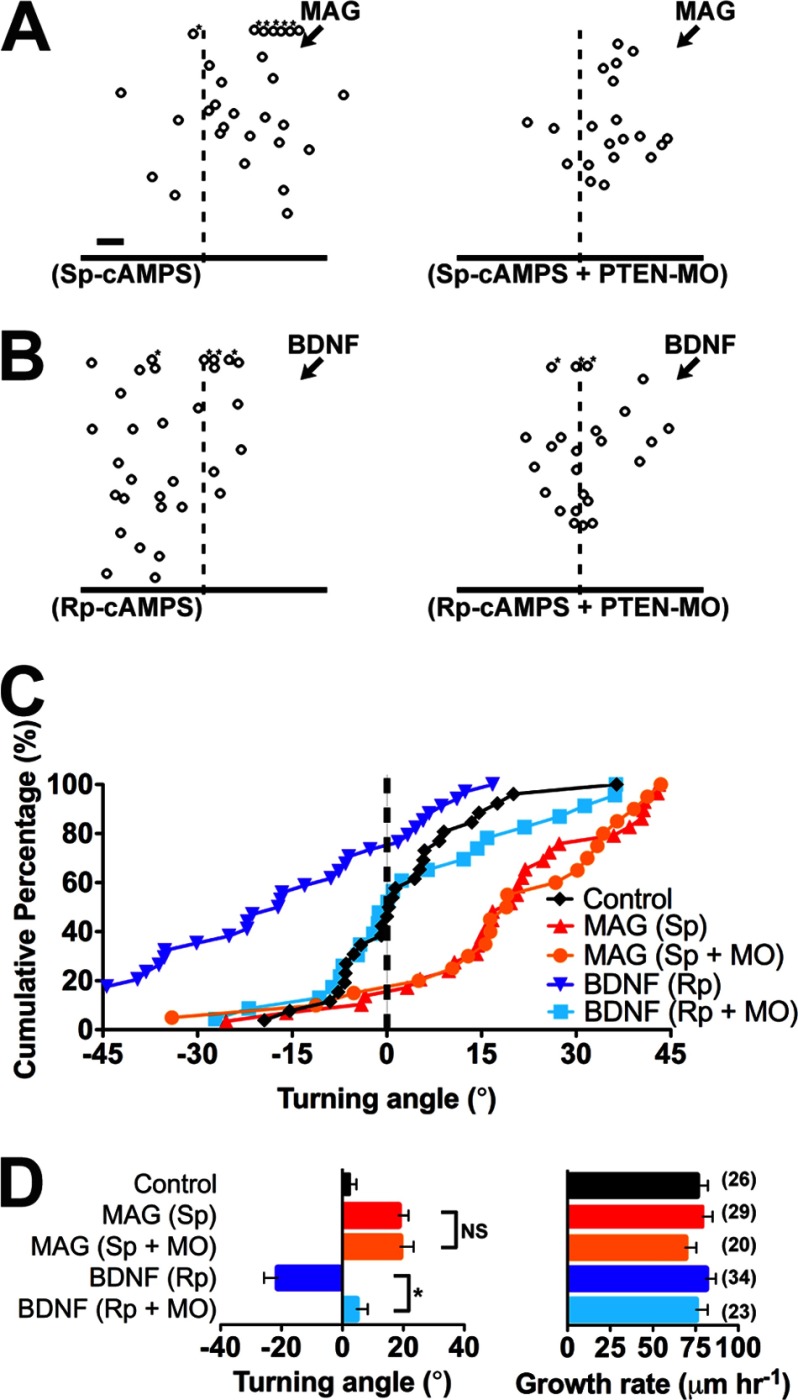
FIGURE 2.
Differential function of PTEN during cAMP-dependent conversion of turning responses. A and B, summary plots depict the final position of wild-type and PTEN-MO growth cones relative to the starting position (origin) after 30 min of exposure to a gradient of MAG (A) and BDNF (B) in the presence of (Sp)-cAMPS and (Rp)-cAMPS, respectively. Scale bar, 10 μm. Asterisks denote growth outside of the plot. C, cumulative distribution of growth cone turning angles for all experiments as in A and B. D, mean turning angles and growth rates for all experiments. All data are mean ± S.E. (n = number associated with each bar; *, p < 0.05; NS, no significant difference, Mann-Whitney U test). The control group in C and D is the same as in Fig. 1, E and F.

