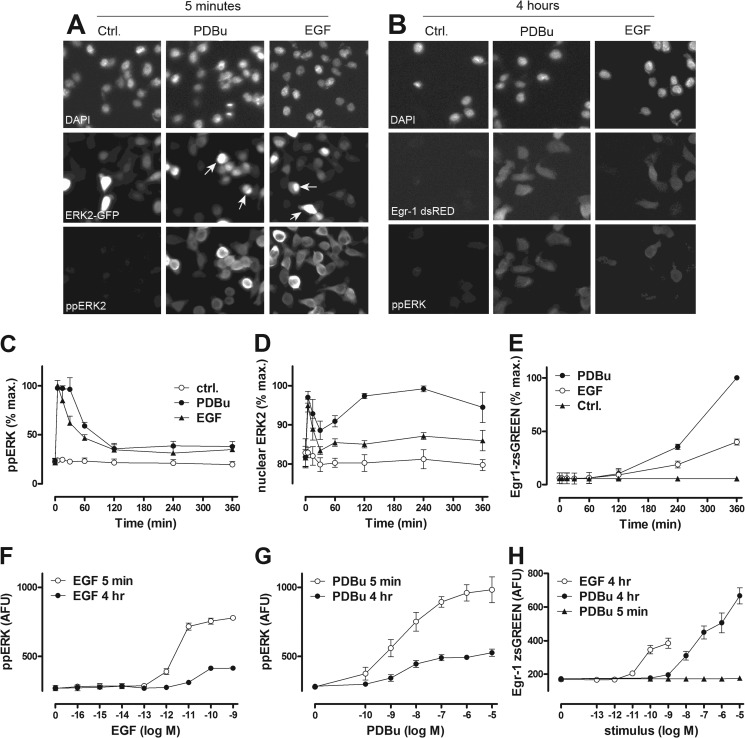
FIGURE 1.
Time and concentration dependence of EGF and PDBu effects on ERK in HeLa cells as revealed by semi-automated fluorescence microscopy. The top panels are digital images illustrating the type of raw data used for this study. Panel A shows cells transfected with siRNA targeting endogenous ERK1 and ERK2, transduced with Ad ERK2-GFP, then stimulated for 5 min with or without EGF (10 nm) or PDBu (1 μm) before being fixed, stained, and imaged for DAPI (nuclei) and ERK2-GFP as well as ppERK2. Panel B shows cells transduced with Ad Egr1-dsRED and stimulated for 4 h with or without EGF or PDBu before being fixed, stained with DAPI, and imaged for DAPI, endogenous ppERK, and dsRED. Digital images were acquired for each fluorophore using a 10× objective and 6–10 fields of view per well, and automated image analysis was then used to define perimeters of nuclei and cells and fluorescence intensity within these areas, as described under “Experimental Procedures.” Each panel has a width of ∼170 μm and, therefore, shows ∼5% of the field captured. These are representative images (from the experiments used for panels C–H) illustrating the ability of EGF and PDBu to increase the proportion of ERK within the nucleus (arrows) and Egr1-driven transcription as well as whole cell ppERK levels. Panels C and D are time-courses from cells with endogenous ERK (C) or after siRNA-mediated knockdown of ERK and Ad-mediated add-back of ERK2-GFP (D) that were incubated from t = 0 with EGF (10 nm, filled triangles) or PDBu (1 μm, filled circles) or control medium (Ctrl., open circles). Panels F and G are from cells with endogenous ERK that were stimulated 5 min or 4 h with the indicated concentrations of EGF or PDBu. Panels E and H are from cells transduced with Ad Egr1-zsGREEN and stimulated as shown. Cells were fixed, stained, imaged, and analyzed as above. The data are whole cell measures except for D, where the proportion of ERK2-GFP in the nucleus is shown. Data shown are population averages from 2–5 experiments (mean ± S.E., n = 2–5) and are in AFU or are normalized to maximal responses to PDBu (in each of the repeated experiments). Data obtained with the Egr1-dsRED reporter (B) are qualitatively similar to those with the Egr1-zsGREEN reporter (E and H).

