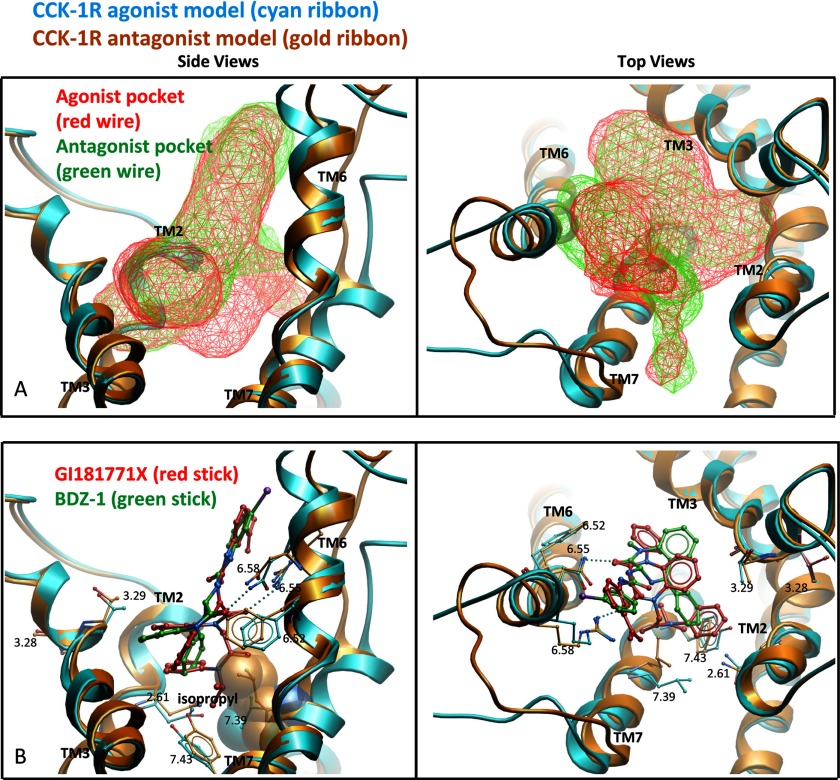
FIGURE 5.
Molecular modeling of docking at CCK1R. Shown are the best performing models for docking the agonist, GI181771X (cyan ribbon and stick) and antagonist, BDZ-1 (gold ribbon and stick) ligands to the type 1 CCK receptor. All ligand conformations have been extensively refined in the Merck Molecular Force Field (31). The left viewpoint is from the side of the TM domain looking through TM4 and the right viewpoint is from the extracellular side with the loops cut away for clarity. A, a comparison of the allosteric ligand binding pockets in the agonist (red wire mesh) and antagonist (green wire mesh) models. The agonist pocket was observed to extend deeper into the TM domain, whereas the antagonist pocket was observed to extend more toward the extracellular region. The surface of the ligand binding pockets were calculated using ICM PocketFinder (17, 23). B, a comparison of the binding pose of GI181771X (red stick) in the agonist model compared with the binding pose of BDZ-1 (green stick) in the antagonist model, as previously reported (3). The isopropyl group in GI181771X was observed to cause a shift in the residues at positions 7.39 (CPK spheres, left image) and 7.43 compared with the antagonist model.

