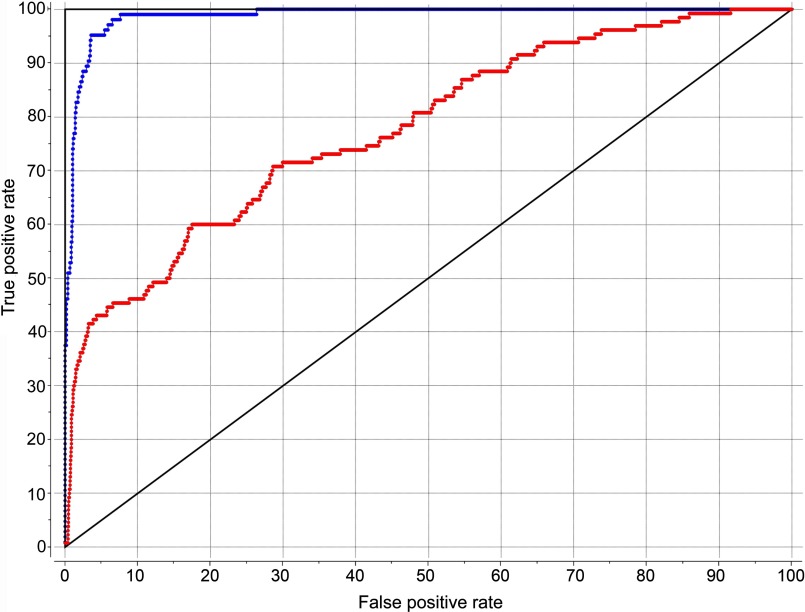
FIGURE 8.
ROC curves. Shown are ROC curves showing the rate of finding true positives versus the rate of finding false positives. The blue curve reflects the ability to distinguish 102 small molecule agonists of the type 1 CCK receptor from 1065 approved drugs in ChEMBL as decoys. The red curve reflects the ability to distinguish 130 small molecule agonists of the type 1 CCK receptor from 2175 non-agonist ligands of the type 1 CCK receptor present in ChEMBL as decoys.

