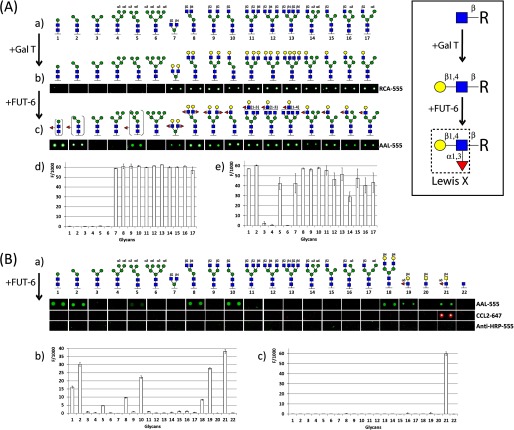
FIGURE 3.
Glycan array screening for FUT-6 substrates. A, N-glycan microarray after enzymatic reaction with bovine milk β1,4-galactosyltransferase followed by C. elegans α1,3-fucosyltransferase (FUT-6) to generate Lewis x type epitopes (boxed inset) on the antennae of complex and hybrid N-glycans. a, non-modified N-glycan structures originally printed on the microarray. b, N-glycan microarray images after galactosylation incubated with the galactose-recognizing lectin from R. communis (RCA-555). c, images of the galactosylated N-glycan microarray after FUT-6 reaction and incubation with the fucose-recognizing lectin from A. aurantia (AAL-555). d, fluorescence intensities of the galactosylated array after incubation with RCA-555. e, fluorescence intensities with AAL-555 after GalT and FUT-6 incubation. B, N-glycan microarray after enzymatic reaction with CeFUT-6 without preincubation with galactosyltransferase. a, N-glycan microarray images after incubation with fucose-recognizing lectins (AAL and CCL2) and anti-HRP-555 antibody. b, fluorescence intensities after incubation with AAL-555. c, fluorescence intensities after incubation with CCL2–647. Compounds 19 and 21, already containing fucose, were included as controls; however, only the latter (LDNF) reacted with CCL2. Each histogram represents the average relative fluorescent unit values for six replicates with the S.D. Red triangles, fucose; yellow circles, galactose; blue squares, N-acetylglucosamine; green circles, mannose.

