
Fig. 2.
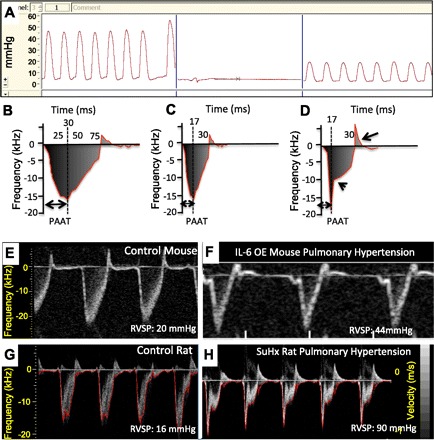
A: hemodynamic measurements in a normal C57BL6 mouse assessed in 2 different locations in the right ventricle. We can appreciate that a slight difference in the site of catheter insertion can cause dramatic changes in pressure recordings, even if the shape of the curve looks apparently normal. B–D: schematic representation of a pulsed-wave Doppler recording of the pulmonary artery. Animals with pulmonary hypertension show a pattern consistent with decreased pulmonary artery acceleration time (PAAT) with or without midsystolic notching (arrowhead). A bidirectional flow pattern appears when pulmonary valve insufficiency is present (D, arrow). E–H: pulsed-wave Doppler recordings from normal mouse (E), mouse overexpressing IL-6 with pulmonary hypertension (F, reproduced from Thibault HB, Kurtz B, Raher MJ, Shaik RS, Waxman A, Derumeaux G, Halpern EF, Bloch KD, Scherrer-Crosbie M. Noninvasive assessment of murine pulmonary arterial pressure: validation and application to models of pulmonary hypertension. Circ Cardiovasc Imaging 3: 157–163, 2010), normal Sprague-Dawley rat (G), and a SU5416/hypoxia exposed Sprague-Dawley rat (H). Compared with mice, rats develop a pulsed-wave Doppler pattern consisting of decreased PAAT, midsystolic notching, and bidirectional flow.