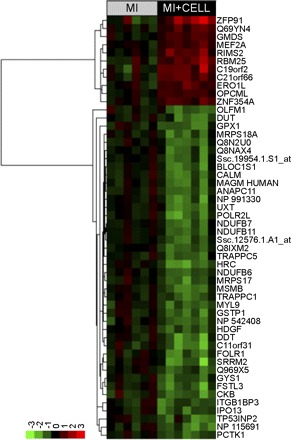
Fig. 4.

Heat map showing all differentially expressed transcripts found using Affymetrix array analyses of heart tissue, with and without exposure to stem cells. Expression levels are normalized to the average value of the untreated heart tissue and are log transformed. The names associated with each probe are the human names obtained from the annotation described in the materials and methods section. The probe names can be found in Table 5. Normalized and raw data are available at GEO under the entry GSE14643 (http://www.ncbi.nlm.nih.gov/geo/).
