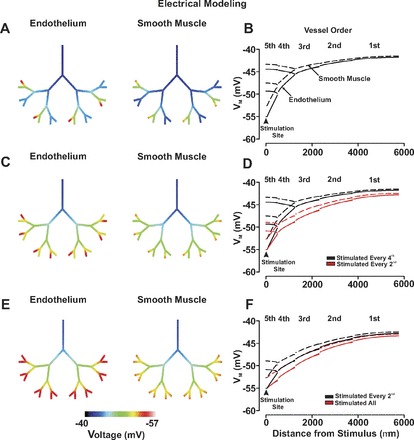
Fig. 7.

The ascension of electrical responses in a virtual arterial network. For simulations, an endothelial segment of every fourth (A and B), every second (C and D), or all (E and F) fifth-order arteries were voltage clamped 15 mV negative to the resting Vm (−40 mV) for 200 ms. Endothelial (solid line) and smooth muscle (dotted line) voltage responses were displayed in steady state with the use of color maps (A, C, and E) or 2-dimensional plots (B, D, and F). Arrow heads denote sites of stimulation.
