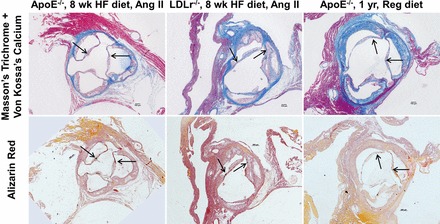
Fig. 10.

Microcalcifications in the ascending aorta of mouse models. Microcalcifications are visible in ApoE−/− (8-wk HF diet with ANG II; left), LDLR−/− (8-wk HF diet with ANG II; middle), and ApoE−/− (1 yr with regular chow diet; right) mouse models, as confirmed by Von Kossa's calcium stain (top) and alizarin red stain (bottom).
