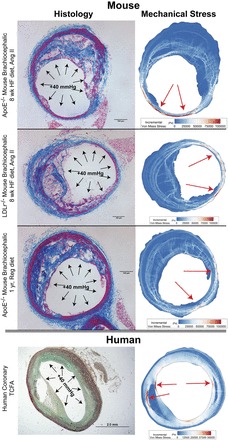
Fig. 5.

Computer model of stress distributions in plaques. We harvested atherosclerotic plaques from three different mouse models (top, middle top, and middle bottom) and obtained thin-cap fibroatheroma (TCFA) specimens from human coronary arteries (bottom). Using finite-element analysis techniques, we computed the distribution of solid mechanical stresses in each vessel cross-section. Local maxima of stress (red arrows) indicate that in mice, highest stresses are on the media and adventitia, particularly on plaque-free walls, whereas in humans, local maxima tend to be on the thin fibrous cap or shoulders of plaques.
