
Fig. 2.
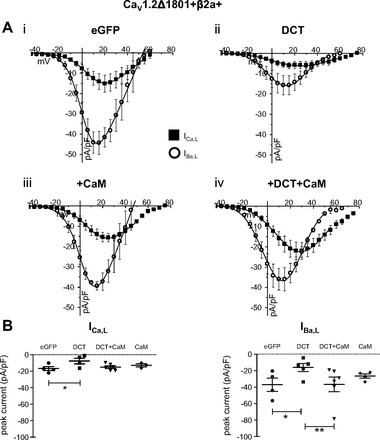
DCT decreases IBa,L, and ICa,L from CaV1.2Δ1801 truncation of CaV1.2 expressed in HEK 293 cells. A: current-voltage relationships for ICa,L (■) and IBa,L (○) for control (i), DCT overexpression (ii), CaM overexpression (iii), and DCT + CaM dual overexpression (iv). B, left: DCT reduces the peak ICa,L density at Vtest +20 mV (P < 0.05). B, right: DCT reduces the peak IBa,L density, and DCT + CaM restores current amplitude. CaM alone has no significant effect. *P = 0.01 and **P = 0.007 for DCT vs. control and DCT vs. DCT + CaM, respectively.