
Fig. 9.
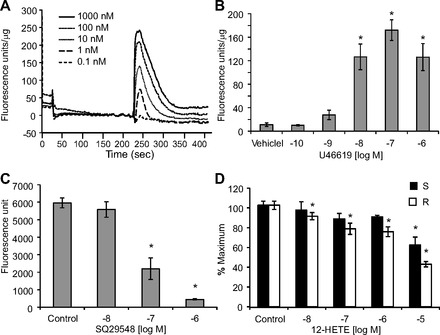
Fluorometric measurement of intracellular calcium in HEK293 cells overexpressing TPα receptor (TPα-HEK). A: representative fluorescence signals induced by increasing concentrations of U46619. B: average fluorescence increases induced by U46619. U46619 did not increase fluorescence in HEK293 cells not overexpressing TP receptors. C: effect of U46619 (10 nM) on fluorescence in the presence of SQ29548 (10 nM to 1 μM). D: U46619 (10 nM)-induced fluorescence in the presence of either 12(S)-HETE (black bar) or 12(R)-HETE (white bar). Percent maximum is the fluorescence signal stimulated by test compound compared with vehicle control as 100%. In A, B, and D, fluorescence was normalized to total protein (fluorescence units/μg). Each value represents the mean ± SE; n = 4–12. *P < 0.05 compared with vehicle control.