
Fig. 4.
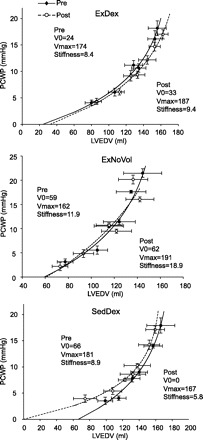
Left ventricular pressure-volume curves before (pre) and after (post) head-down tilt bed rest in ExDex, ExNoVol, and SedDex groups. Shown are mean ± SE group data. Six data points correspond to 2 degrees of LBNP, 2 baselines, and 2 saline infusions. Dextran infusion groups (ExDex and SedDex) have 7 data points in the post-bed rest results, including another data point from before dextran infusion. V0, Vmax, and Stiffness are equilibrium volume, maximum volume, and stiffness constant from the logarithmic model. These indexes are derived from group mean data points and thus differ from the mean of the individual values in Table 3. LVEDV, left ventricular end-diastolic volume.