
Fig. 1.
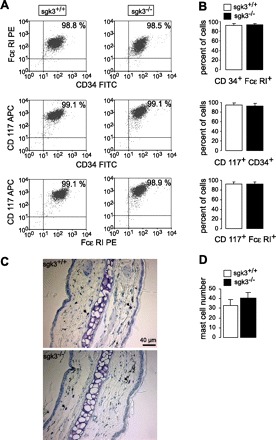
Maturation of bone marrow mast cells (BMMCs) from sgk3+/+ and sgk3−/− mice. A: original dot plots of CD117-, CD34-, and FcεRI-positive BMMCs from sgk3+/+ and sgk3−/− mice. Numbers depict the percentage of cells in the respective quadrant, acquired within the mast cell gate. B: frequency of mast cells in primary culture. Mean percent (± SE; n = 6 individual BMMC cultures) of sgk3+/+ (open bars) and sgk3−/− (closed bars) BMMCs acquired within the mast cell gate. C: ear conche sections of sgk3+/+ (top) and sgk3−/− (bottom) mice stained with toluidine blue for mast cell detection (mast cells are indicated by black arrows). D: number of mast cells (±SE) in skin, analyzed by staining of ear conche sections with toluidine blue. Mean mast cell numbers of toluidine blue-positive cells in one area (×200 magnification) as calculated from 10 different areas on different slices per conch of 4 sgk3+/+ (open bar) and 3 sgk3−/− (closed bar) mice (P = 0.43, two-tailed unpaired t-test).