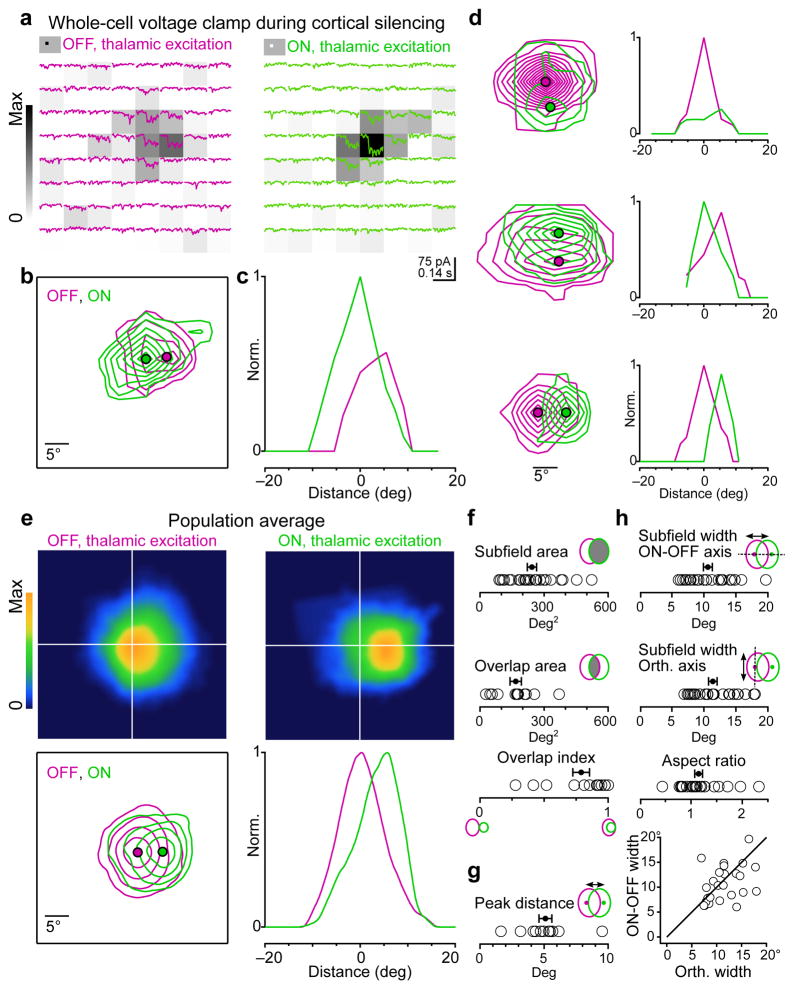
Figure 2. Receptive field structure of thalamic excitation.
a, Example cell. Isolated thalamic excitation (EPSCThal) in response to black (“OFF”, magenta traces, left) or white (“ON”, green traces, right) squares at each of 64 locations on an 8×8 grid. Stimuli appear at the beginning of each trace and last for 100 ms. The raw receptive field heat maps calculated from the thalamic excitatory charge (QThal) evoked at each grid location and normalized to the peak ON response are depicted by the background gray-level of each trace. Average of 4 trials per location. b, Contour plot of the OFF and ON subfields for the cell in a. Each contour represents 2 z-scores. Filled magenta and green circles mark the peaks of the OFF and ON receptive fields, respectively. c, Profile plot of OFF and ON receptive fields in c along the axis connecting their peaks. d, Same as b and c for 3 additional neurons. e, Population average of OFF and ON receptive fields. Before averaging, the receptive fields for each cell were centered on the peak of the OFF subfield and rotated so that the peak of the ON subfield was directly to the right of the OFF. OFF and ON subfields were separately normalized. Top, heat maps of the population average OFF and ON receptive fields. Bottom, contour and profile plots of the population average receptive fields as in b and c. The outermost contour represents 10% of the peak and each additional contour is an increment of 20% of the peak. f, Quantification of subfield area (n = 26 subfields) and overlap between ON and OFF subfields (n = 13 cells). g, Distance between the peaks of ON and OFF subfields (n = 13 cells). h, Comparison of subfield width along the axis connecting the ON and OFF peaks (ON/OFF axis) or the orthogonal axis (n = 26 subfields). Black line, unity. Data in e–h are from 13 cells each exhibiting 1 OFF and 1 ON subfield from 12 mice. Error bars, mean ± s.e.m.

