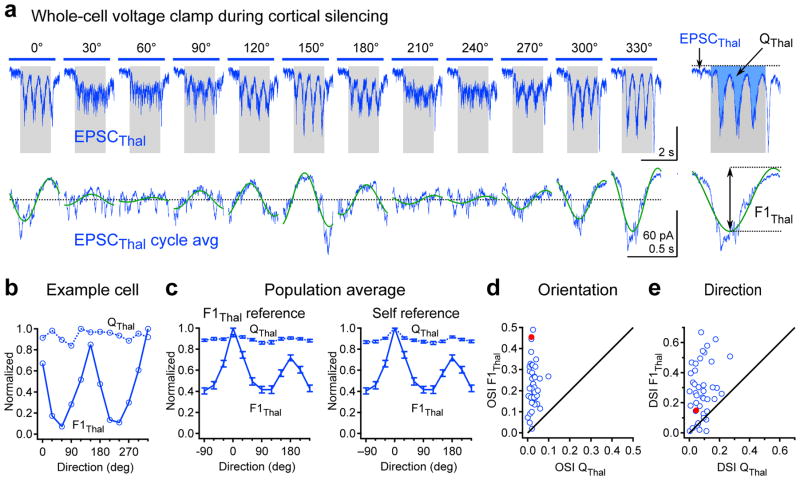
Figure 3. Orientation tuning of thalamic excitation.
a, Example cell: Top, Isolated thalamic excitation (EPSCThal) in response to drifting gratings of various orientations (average of 8 trials per direction). Gray rectangle, visual stimulus (1.7 s). Blue bar, LED illumination (2.6 s). Bottom, F1 modulation of EPSCThal. Cycle average (blue) and best-fitting sinusoid (green) at the grating temporal frequency (2 Hz). The y-offset was removed to aid comparison of F1 amplitude across different orientations. Right, EPSCThal and cycle average in response to 330 degree grating at expanded time scale showing how QThal and F1Thal are determined. b, Orientation tuning curves of QThal (dashed line) and F1Thal (solid line) for the neuron in (a). c, Population tuning curves of QThal (dashed line) and F1Thal (solid line). Left, Population tuning curves in which QThal and F1Thal tuning curves for each cell were equally shifted so that the preferred direction of F1Thal occurred at 0 degrees (F1Thal reference). Right, Population tuning curves in which QThal and F1Thal tuning curves for each cell were independently shifted so that preferred direction of QThal and F1Thal both occurred at 0 degrees (self reference). d, Orientation selectivity index (OSI) of QThal plotted against OSI of F1Thal for each cell. e, Direction selectivity index (DSI) of QThal plotted against DSI of F1Thal for each cell. Filled red markers in d and e denote the OSI and DSI values of the example cell. Data in c–e are from n = 42 cells from 33 mice. Error bars, mean ± s.e.m.

