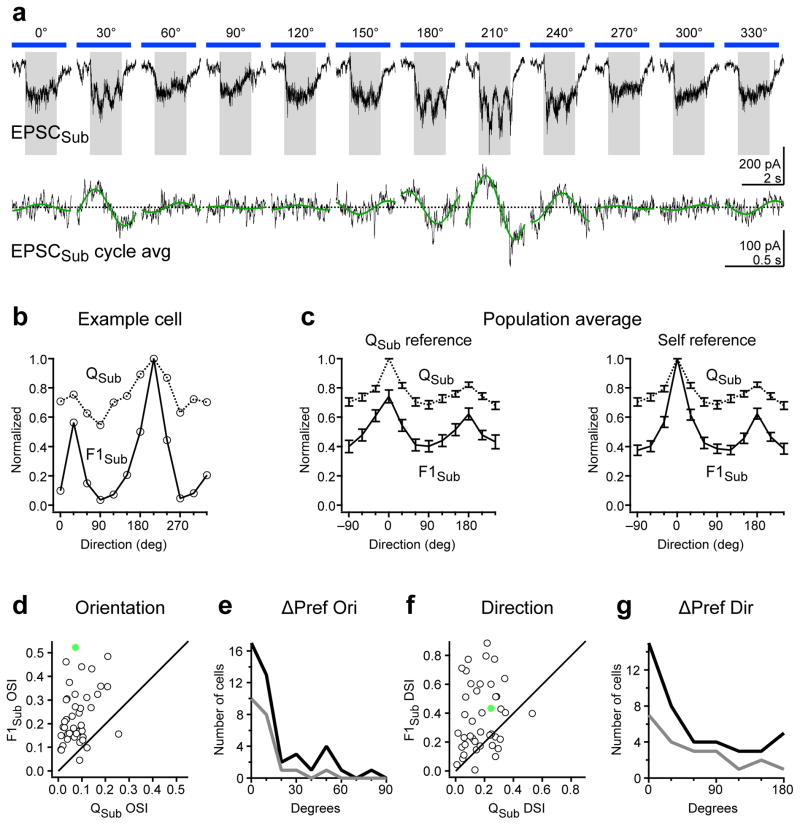
Figure 6. Tuning of non-thalamic excitatory F1 modulation.
a, Example cell: Top, EPSCSub in response to drifting gratings of various orientations. Gray rectangle, visual stimulus (1.5 s). Blue bar, LED illumination (2.6 s). Bottom, F1 modulation of EPSCSub. Cycle average (black) and best-fitting sinusoid (green) at the grating temporal frequency (2 Hz). b, Orientation tuning curves of QSub (dashed curve) and F1Sub (solid curve) for the example cell in a. c, Population tuning curve of QSub (dashed curve) and F1Sub (solid curve). Left, Population tuning curves in which QSub and F1Sub tuning curves for each cell were equally shifted so that the preferred direction of Qsub occurred at 0 degrees (Qsub reference). Right, Population tuning curves in which QSub and F1Sub tuning curves for each cell were independently shifted so that preferred direction of QSub and F1Sub both occurred at 0 degrees (self reference). d, OSI of F1Sub is plotted against OSI of QSub for all neurons. e, Distribution of absolute differences in preferred orientation (ΔPref Ori) between QSub and F1Sub. Dark curve, all cells (n = 42). Gray curve, cells in the top 50th percentile of F1Sub OSI (n = 21). f–g, Same as (d–e) for DSI and absolute differences in preferred direction (ΔPref Dir). Filled green markers in d and f denote the OSI and DSI values of the example cell. Data in c–g are from n = 42 cells from 33 mice. Error bars, mean ± s.e.m.

