
Fig. 4.
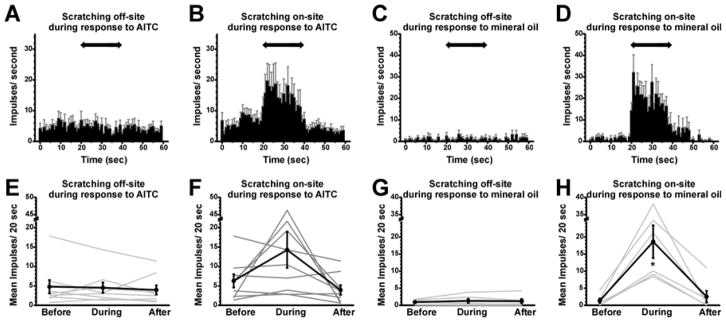
Effects of scratching on AITC-evoked firing. A: PSTH of averaged neuronal firing (n=9) following application of AITC (format as in Fig. 3A). B: as in A for on-site scratching. C: PSTH of averaged neuronal firing (n=6) following application of mineral oil, with off-site scratching. D: as in C for on-site scratching. E: Graph plots mean AITC-evoked firing rate before, during and after off-site scratching (format as in Fig. 3E). F: graph as in E for on-site scratching. G: mean firing rate following application of mineral oil, with off-site scratching. H: graph as in G for on-site scratching. *: significantly different from before (p<0.05, Bonferroni following one-way repeated measures ANOVA).