
Figure 7. DAVID-EASE Gene Ontology of differentially regulated genes.
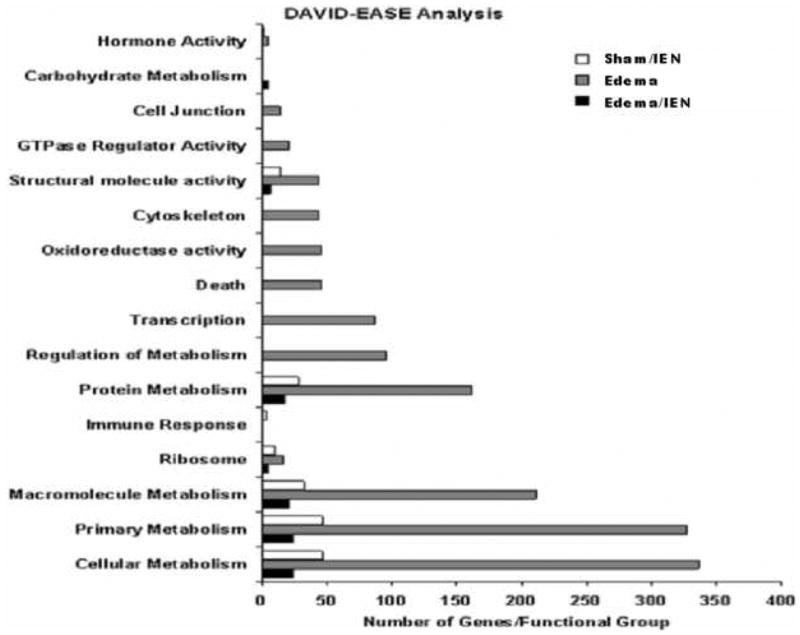
Gene ontology was performed using the DAVID-EASE software. The y-axis denotes the functional category assigned to individual gene ID numbers. The x-axis denotes the total number of genes both up and down-regulated in the groups. n = 4-5.