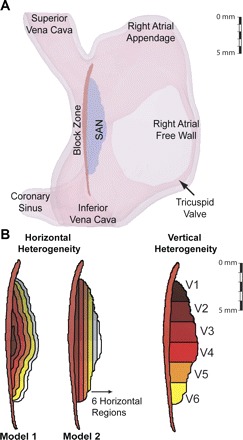
Fig. 1.

A: right atrium (RA) geometry indicating the sinoatrial node (SAN), septal, and the block zone. B: isolated SAN showing regions used to define gradients in ionic parameters and conductivity. Two different models used for horizontal gradients are shown at left. Color indicates region with numbering beginning with darker colors. Note that not all vertical regions overlap with all horizontal regions.
