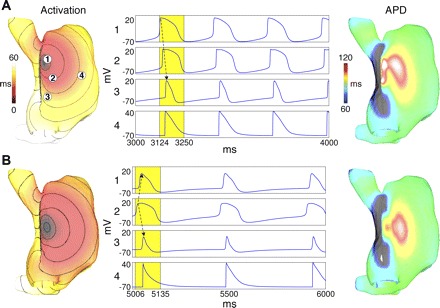
Fig. 3.

Activation maps (left), transmembrane voltages (middle), and APD maps (right) for different leading pacemaker sites (LPSs). A: superior LPS. B: central LPS. Voltage traces were obtained at locations labeled in A. Activation and APD maps were computed over yellow windows. The 10-ms isochrones are displayed on activation maps with black indicating inexcitable regions. Arrows in time traces indicate the sequence of propagation within the SAN.
