
Fig. 6.
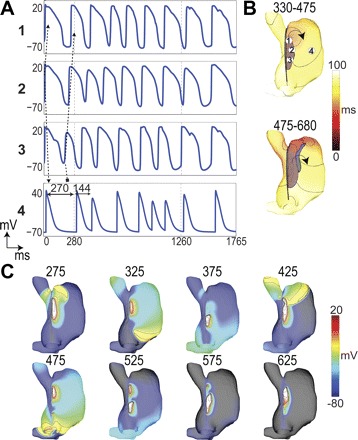
Clockwise reentry after vagal stimulation. A: voltage traces were obtained at locations labeled in B. An unidirectional block from 3 to 4 leads to reentry. Arrows show sequence of activation. Cycle lengths in trace 4 (myocardium) show the onset of the reentry. B: activation maps for 2 cycles of reentry over the periods (in ms) indicated. C: voltage maps taken at the times indicated with 10-mV isopotential lines displayed.