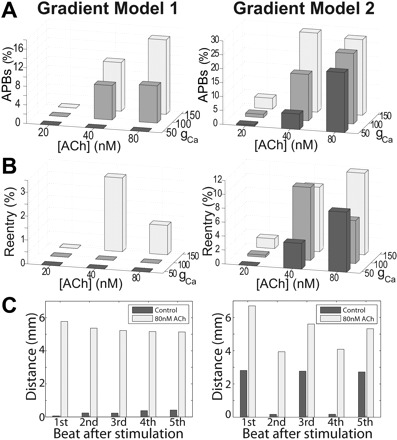
Fig. 7.

Comparison of SAN gradient models. A: occurrence of APBs for different maximum [ACh]s and gCa,L. B: occurrence of reentry for different [ACh]s and gCa,L. C: LPS shifting in control and after 80 nM [ACh]. Distance is measured from the cranial end of the SAN complex.
