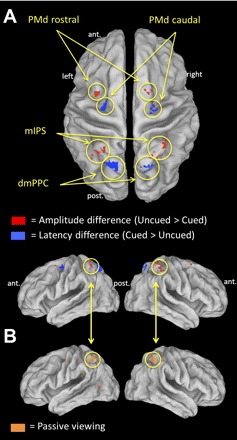
Fig. 4.

Regions of interest. A: topography of areas showing a significant amplitude difference (mIPS and PMd rostral; shown in red) and latency difference (dmPPC and PMd caudal; in blue) across cue conditions, overlaid on an inflated cortical surface (P < 0.05 FDR corrected). B: regions activated during left and right arm reaching as well as during passive viewing of visual stimuli. A region corresponding to the mIPS (circled) was isolated in this active/passive conjunction (P < 0.05 FDR corrected).
