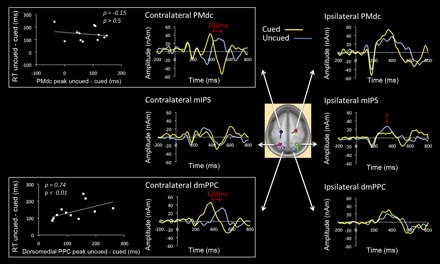
Fig. 6.

Functional magnetic resonance imaging (fMRI)-informed source analysis. Source waveforms are shown in the cued and uncued conditions for bilateral PMdc, mIPS and dmPPC. Center: location of the dipoles, taken from the coordinates of peak activity in these regions in the fMRI analysis, superimposed on an average brain. Note that data for the 2 arms are collapsed into a single estimate (see materials and methods). In support of the fMRI and CSD results, the source analysis confirmed the difference in the timing of peak activity in the contralateral PMdc and dmPPC as a function of cue condition (horizontal red arrows in boxed graphs). Graphs at left present the correlation between each subject's difference in the timing of peak activity between cue conditions and the difference in RT between cue conditions, shown for the contralateral PMdc (top) and dmPPC (bottom). The difference in the timing of dmPPC recruitment between cued and uncued conditions predicted well the difference in RT across these conditions (P < 0.01). This was not the case for PMdc (P > 0.5).
