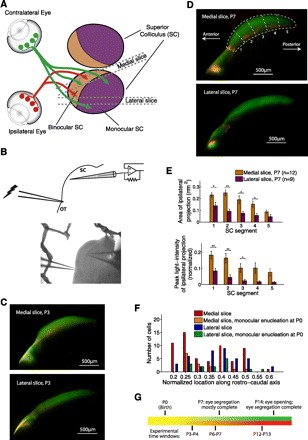
Fig. 1.

Brain slices for electrophysiological recordings from the medial and lateral superior colliculus (SC). A: schematic of retinal inputs to the mouse SC (dorsal view). The antero-medial crescent of the SC receives binocular retinal input, whereas the posterior-lateral SC receives input predominantly from the contralateral eye. We designed 2 brain slice preparations for electrophysiological recordings from the medial and lateral SC by optimizing cutting orientations in 3 dimensions, both slices cut approximately perpendicular to the surface of the hill-shaped SC to minimize damage to retinal fibers and to SC neurons during slicing (see materials and methods for cutting angles and further details). B, top: recording configuration: in both slices, we measured retinocollicular synaptic currents by performing patch-clamp recordings from neurons in the SGS layer of the SC while electrically stimulating retinal fibers passing through optic tract (OT). Bottom: DIC image of a postnatal day (P)7 medial slice. C: examples of medial (top) and lateral (bottom) slices prepared at P3 after whole-eye injections of tracer dyes at P1 (red/green for ipsilateral/contralateral eyes, respectively; see materials and methods). At this age, ipsi- and contralateral inputs are mixed in the SGS layer of the antero-medial SC. D: examples of medial and lateral slices prepared at P7 after whole eye injections of tracer dyes at P5. We divided the SC into 5 segments along the antero-posterior axis. All electrophysiological recordings were confined to segments 2 and 3 of the SC (20–60% along the antero-posterior axis; see F for distribution of recording locations). E: quantification of ipsilateral retinal input in the 2 slices at P7. Ipsilateral input was stronger, covered a larger area, and extended more posteriorly in the medial than the lateral slice, in accord with the anatomical location of the slices. Two-tailed Student's t-test with false discovery rate procedure for multiple-comparisons (data in this and following figures presented as means ± SE): *P < 0.05, **P < 0.01. F: recording locations along the antero-posterior axis. Mean recording locations for the medial slice (nonenucleated mice), medial slice after monocular enucleation at P0, lateral slice (nonenucleated mice), and lateral slice after monocular enucleation at P0 were 0.335 ± 0.015 (n = 59), 0.307 ± 0.021 (n = 14), 0.376 ± 0.016 (n = 40), and 0.363 ± 0.02 (n = 15), respectively. Recording locations did not differ significantly among the 4 groups [F(3,124) = 2.15, P = 0.098, 1-way ANOVA]. G: time line of eye-specific segregation in the SC and experimental time windows.
