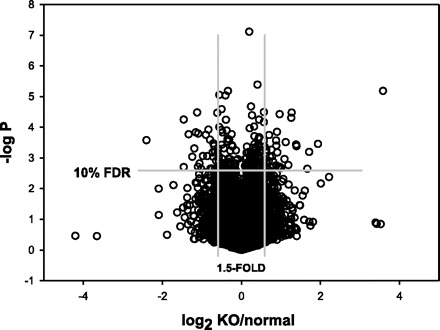
Fig. 2.

Distribution of gene expression differences between myostatin-knockout (KO) and normal muscles, according to magnitude of mean difference (x-axis is log2 of KO:normal ratio) and nominal P according to t-tests (negative log10 of P value is shown). Each circle represents the mean difference for a single probe set. The total number of probes sets included in the analysis after filtering out noninformative probes (see text) was 32,462. FDR, false discovery rate.
