
Fig. 2.
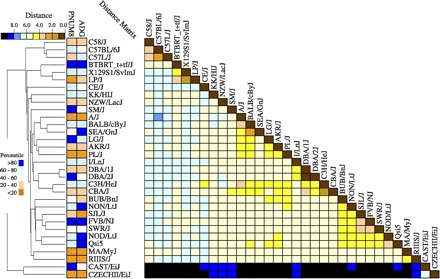
Comparison of genetic relatedness with ADG and maternal pup survival among 32 inbred mouse strains. A dendrogram (left) illustrating the genetic relatedness among the strains used in this study is presented alongside a heat map (middle) illustrating the relative ranking for ADG and PNUM8. An additional heat map (right) illustrates the pairwise relatedness among the strains expressed as a Pearson's distance (d = 1 − r, where r is Pearson's correlation). The dendrogram is a UPGMA tree based on average haplotype block identity across the entire genome. Pair-wise genetic distances between strains were computed as described under genetic similarity in materials and methods.