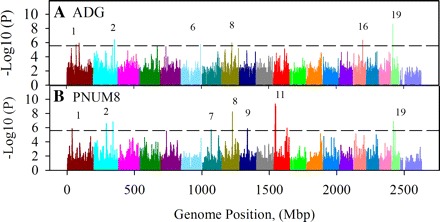
Fig. 3.

Manhattan plots illustrating significant genome-wide associations for ADG and PNUM8. The graphs present the results of haplotype association analysis for ADG (A) and PNUM8 (B). Each bar represents the location in the genome that begins a haplotype block. The significance threshold for a Bonferroni-corrected genome-wide (GW05) P value of α = 0.05 (2.75 × 10⁻⁶) is indicated by the dashed line.
