
Fig. 5.
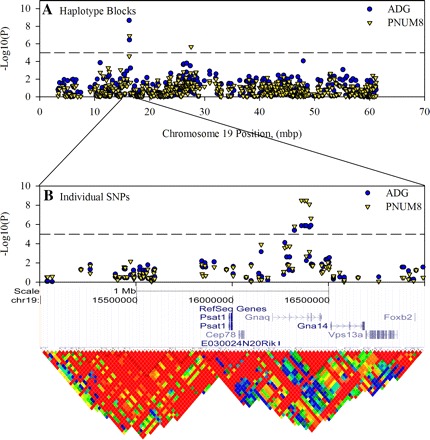
Definition of haplotype blocks on MMU19 that are in close proximity of the gene for Gnag. SNP data for MMU19 were loaded into Haploview to confirm the block structure in this region and define the major haplotypes for the region. This same data were also used in an independent single SNP analysis using the efficient mix-model analysis server (http://mouse.cs.ucla.edu/emmaserver/). Association score is plotted against the position for the start of each of 473 haplotype blocks that were defined on this chromosome (A). The region from 15 to 17 Mbp is enlarged to illustrate highly significant single SNP associations in relationship to known genes and LD, which is expressed as r2 in the heat map (B).