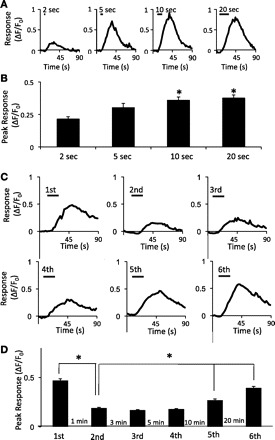
Fig. 4.

Responses to shear force at different stimulation durations and to repeated shear force stimulation. A: sample traces show responses of a cell to 1.6 dyn/cm2 shear force at durations of 2, 5, 10, and 20 s. The horizontal bar above each trace indicates the duration of shear force application. B: summary of peak responses of cells to 1.6 dyn/cm2 shear force at durations of 2, 5, 10, and 20 s. C: sample traces show responses of a cell to repeated shear force stimulation. The intensity of each stimulus was 1.6 dyn/cm2 and the duration 20 s. The time intervals between each stimulus are shown in D. D: bar graph shows summary of peak responses of cells to repeated shear force stimulation at different intervals. Data represent means ± SE. *P < 0.05.
