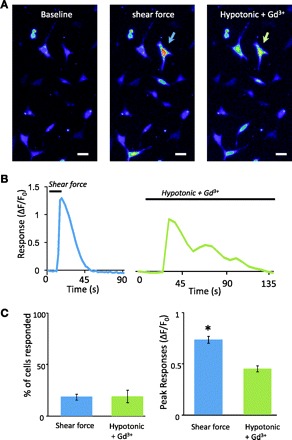
Fig. 7.

Responses induced by hypotonic solution. A: images show Fluo-3 fluorescence intensity in cells before (1st panel) and after the application of 1.6 dyn/cm2 shear force (2nd panel) or the application of a hypotonic solution (3rd panel). The hypotonic solution was applied in the presence of 100 μM Gd3+. A cell that responded to both shear force and hypotonic solution is indicated by arrows in 2nd and 3rd panels. Scale bars, 20 μm. B: traces are the responses of the cell indicated in A to 1.6 dyn/cm2 shear force (left) and the hypotonic solution (right). The horizontal bar above each trace indicates the stimulation duration. C, left: summary of the percentage of the cells that responded to shear force (n = 7 dishes, total 196/1,143 cells) and hypotonic solution (n = 7 dishes, 189/1,143 cells). Right: peak responses to the shear force (n = 196 cells) and the hypotonic solution (n = 189). In each experiment, the hypotonic solution was applied in the presence of 100 μM Gd3+. Data represent means ± SE. *P < 0.05.
