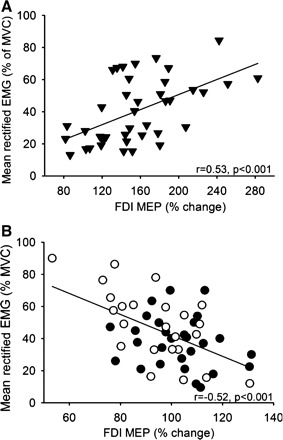
Fig. 6.

Correlation analysis between the changes in FDI MEP size during 30% and 70% of MVC during the index finger abduction and elbow flexion motor tasks and mean rectified EMG activity exerted during the same motor tasks in healthy control subjects (A, ▾) and patients with cervical SCI with poor (B, ○) and good (B, ●) recovery. In both graphs, x-axis shows the size of the FDI MEP during 30% and 70% of MVC expressed as % of the FDI MEP size at rest and y-axis shows the mean rectified EMG activity in the FDI expressed as % of the MVC. Note that larger changes in mean rectified EMG activity in the FDI muscle were associated with larger FDI MEP size in healthy control subjects and smaller FDI MEP size in patients with SCI.
