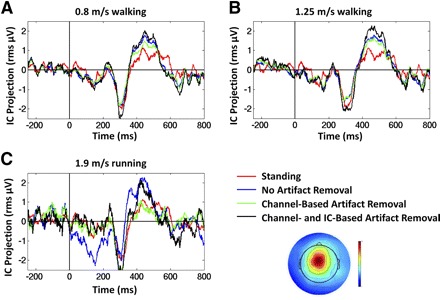
Fig.10.

Mean target ERP of a mediofrontal IC from a representative subject. The scalp topography of the selected IC is shown below the legend. Traces show ERPs in 3 gait conditions: (A) walking at 0.8 m/s; (B) walking at 1.25 m/s; and (C) running at 1.9 m/s. In each panel, the ERP while standing is shown (red traces) along with ERPs in 3 stages of analysis: before artifact removal (blue traces); after performing channel-based artifact removal (green traces); and after subsequent IC-based artifact removal (black traces). Zero latency represents the onset of the visual target stimulus. Vertical axis units: root-mean square microvolt projection of the IC process to all scalp electrodes.
