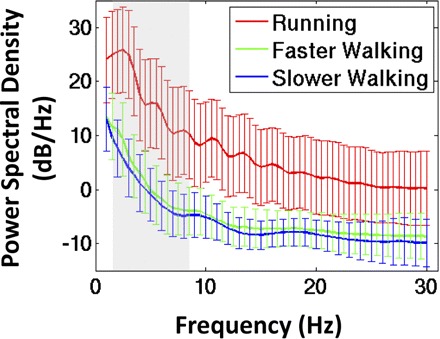
Fig.3.

Grand average power spectral density (±SD) of the independent component (IC)-based artifact templates that were removed from the EEG signals during walking at 0.8 m/s (blue line), walking at 1.25 m/s (green line), and running at 1.9 m/s (red line). The shaded region indicates the frequency band (1.5–8.5 Hz) used in subsequent statistical analyses.
