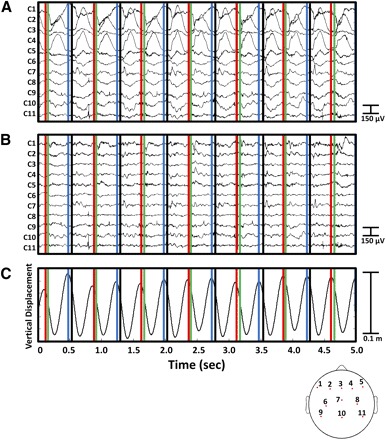
Fig.5.

A 5-s sample of EEG data from a representative subject running at 1.9 m/s (A) before and (B) after performing channel-based and IC-based artifact removal. The corresponding vertical center-of-mass displacement is shown in C. Vertical lines indicate left toe off (red), right heel strike (green), right toe off (blue), and left heel strike (black). Bottom: topographical layout of the 11 displayed EEG channels.
