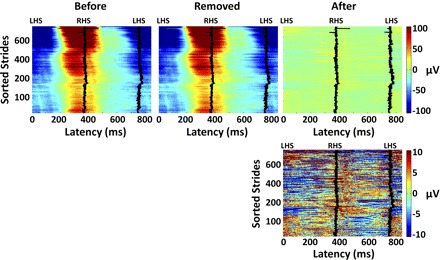
Fig.6.

Single-stride EEG signals at channel C1 (Fig. 5) during running at 1.9 m/s for a representative subject, plotted as color-coded horizontal lines smoothed with a (vertical) moving average of 5 strides. Strides are sorted chronologically; 0 latency represents a left heel strike (LHS) and the solid traces represent the latency of the next right and then left heel strikes (RHS and LHS, respectively). Top left: the EEG signals before artifact removal. Top middle: the gait-related artifact templates removed. Top right: the EEG signals remaining after channel- and IC-based artifact removal. Bottom right: the EEG signals remaining shown on a 10-times finer color scale than the top panels.
