
Fig. 3.
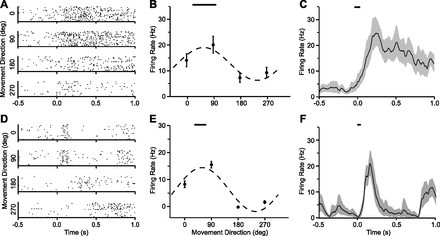
Responses from a representative neuron to the active (A–C) and passive (D–F) tasks. Individual raster plots show timing of spikes to movements in each of the four directions (A and D). Tuning curves are shown in B and E. Bars at the top indicate the 95% confidence interval for the corresponding preferred direction (PD). C and F: time course of the response in the preferred direction, which was 90° for this cell. Bars at the top indicate 95% confidence interval of firing rate onset. Time zero indicates movement onset.