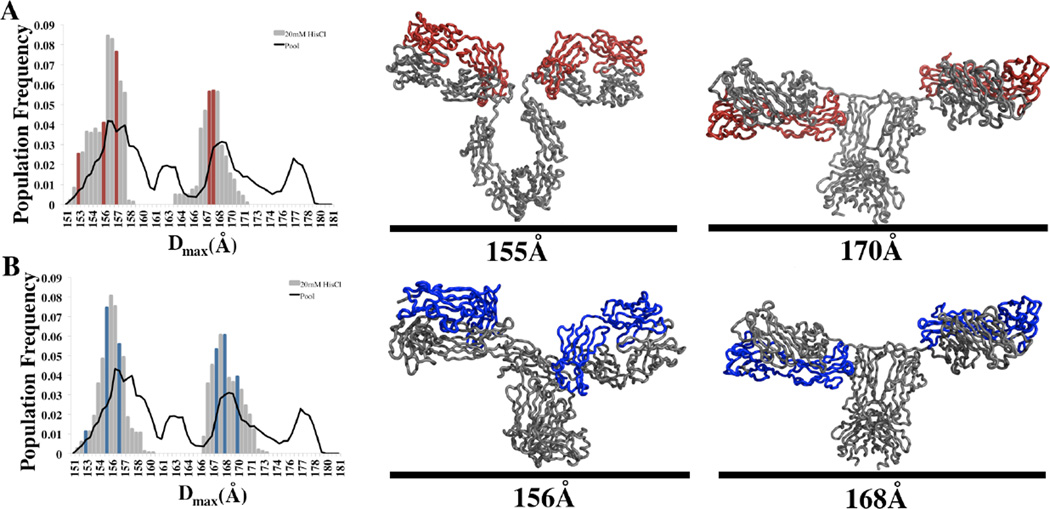
Figure 3. MSE Analysis of the Solution Conformations of mAb1 and mAb2 in 20mM HisCl pH 6.0.
MSE Analysis of both mAb1 (A) and mAb2 (B) reveals a bimodal distribution of sizes. The histograms for each mAb illustrate that similar distribution of sizes are selected during 50 repetitions of the MSE process. The histograms illustrates that although the pool of mAb structures contains many structures throughout the size range of 151–180Å, the SAXS data for both mAb1 and mAb2 are best described by including a bimodal distribution of conformations with a Dmax of ~156 and ~170Å. The single best MSE for both mAbs contain structures (highlighted in color) selected from both subpopulations of the bimodal distribution. Examples of the selected structures for both mAb1 and mAb2 are depicted to the right of each histogram. The light chains of each mAb are highlighted for clarity.

