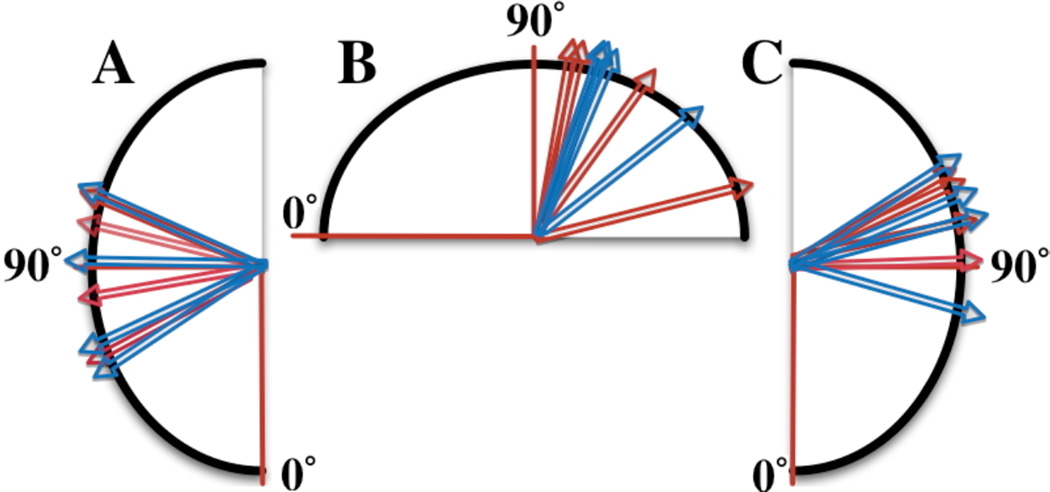
Figure 4. The Fab-Fab and Fab-FC angular distribution of MSE Structures for both mAb1 and mAb2.
(A)Fab1-FC, (B) Fab1–Fab2, (C) Fab2-FC, translated to a common origin. The red arrows represent the data for mAb1, while the blue arrows represent the data for mAb2. mAb1 and mAb2 show a similar distribution of angles between domains. The data are consistent with published results1 and are summarized in Table 1.

