Figure 2.
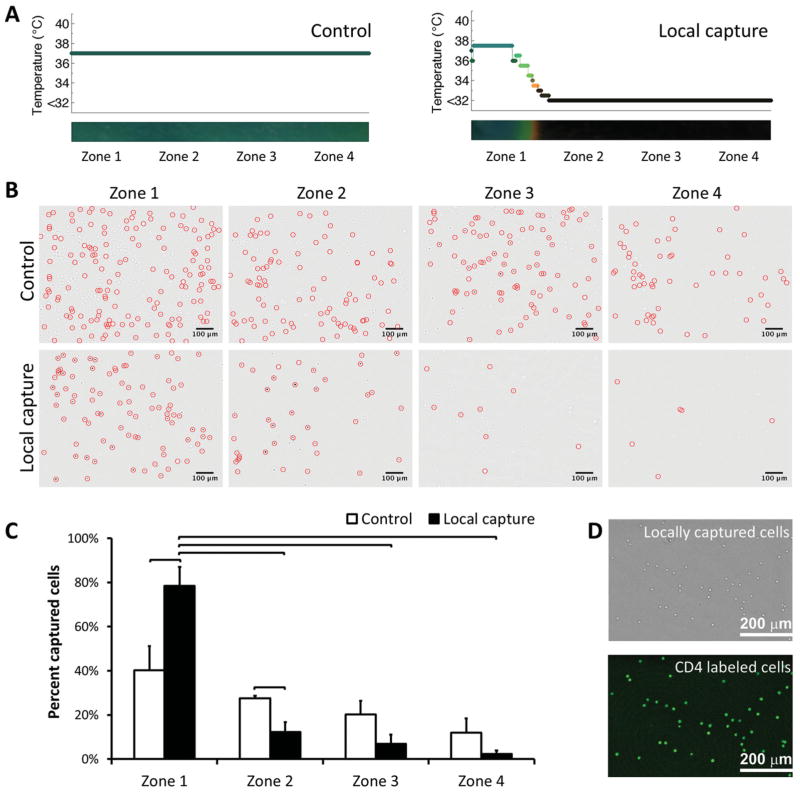
Local cell capture in microchannels. A) Temperature distribution in control and local capture channels. In local capture channels, temperature was controlled locally, enabling local capture of cells in zone 1 only. B) Typical images of cells in channels in zones 1–4 before and after capture of cells (cells were marked with circles). Images indicated a significant difference in number of cells captured in zone 1 compared to zones 2–4. Cells captured in zones 1–4 in control channels displayed a typical distribution pattern for cell capture in microchannels. C) Quantitative analysis of cell capture in zones 1–4, in control and local capture channels. A statistically significant, greater number of cells were captured in zone 1 (79% ±4%, n = 4 channels) compared to zone 1 of control channel and zones 2–4 of local capture channel. Each zone corresponded to 4.3 mm of the 25 mm full channel length. D) Bright field and CD4 immunofluorescent stained locally captured cells indicating the capture specificity of the channels. Capture specificity of the channels was quantified to be 92% (±2%, n = 4 channels). (Brackets connecting individual groups indicate statistically significant difference. Non-parametric Mann-Whitney U test, p < 0.05).

