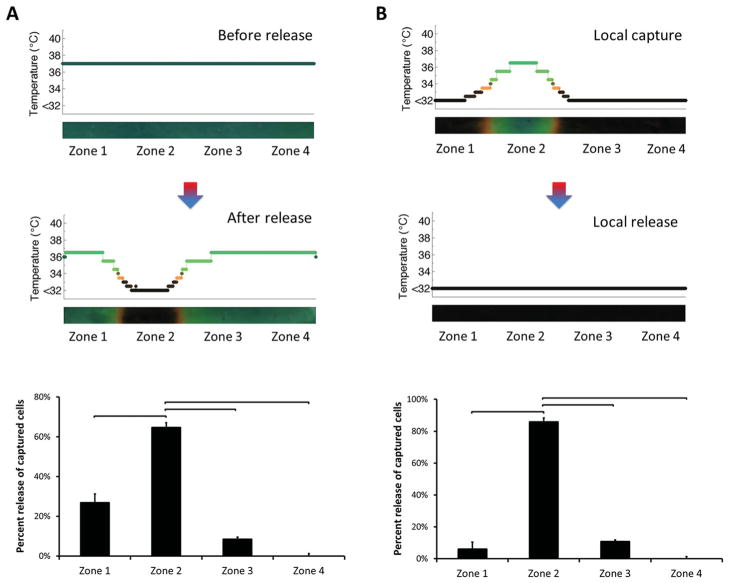
Figure 5.
Local capture and release of cells in zones close to the middle of channels. Temperature was controlled locally, which resulted in local capture and release of cells in zone 2 only. A) A statistically significant number (65% ± 8%, n = 4 channels) of captured cells was released locally in zone 2, at which temperature control was performed. B) Release of locally captured cells in zone 2. A statistically significant number (86% ± 7%, n = 4 channels) of captured cells was released locally in zone 2, at which local capture and release was performed. These results indicated the capability of controlling local capture and release of cells towards the middle of the channels. Each zone corresponded to 4.3 mm of the 25 mm full channel length. (Brackets connecting individual groups indicate statistically significant difference. Non-parametric Mann-Whitney U test, p < 0.05)

